MSIP Shiny GUI Usage
msip_shiny_demo.Rmd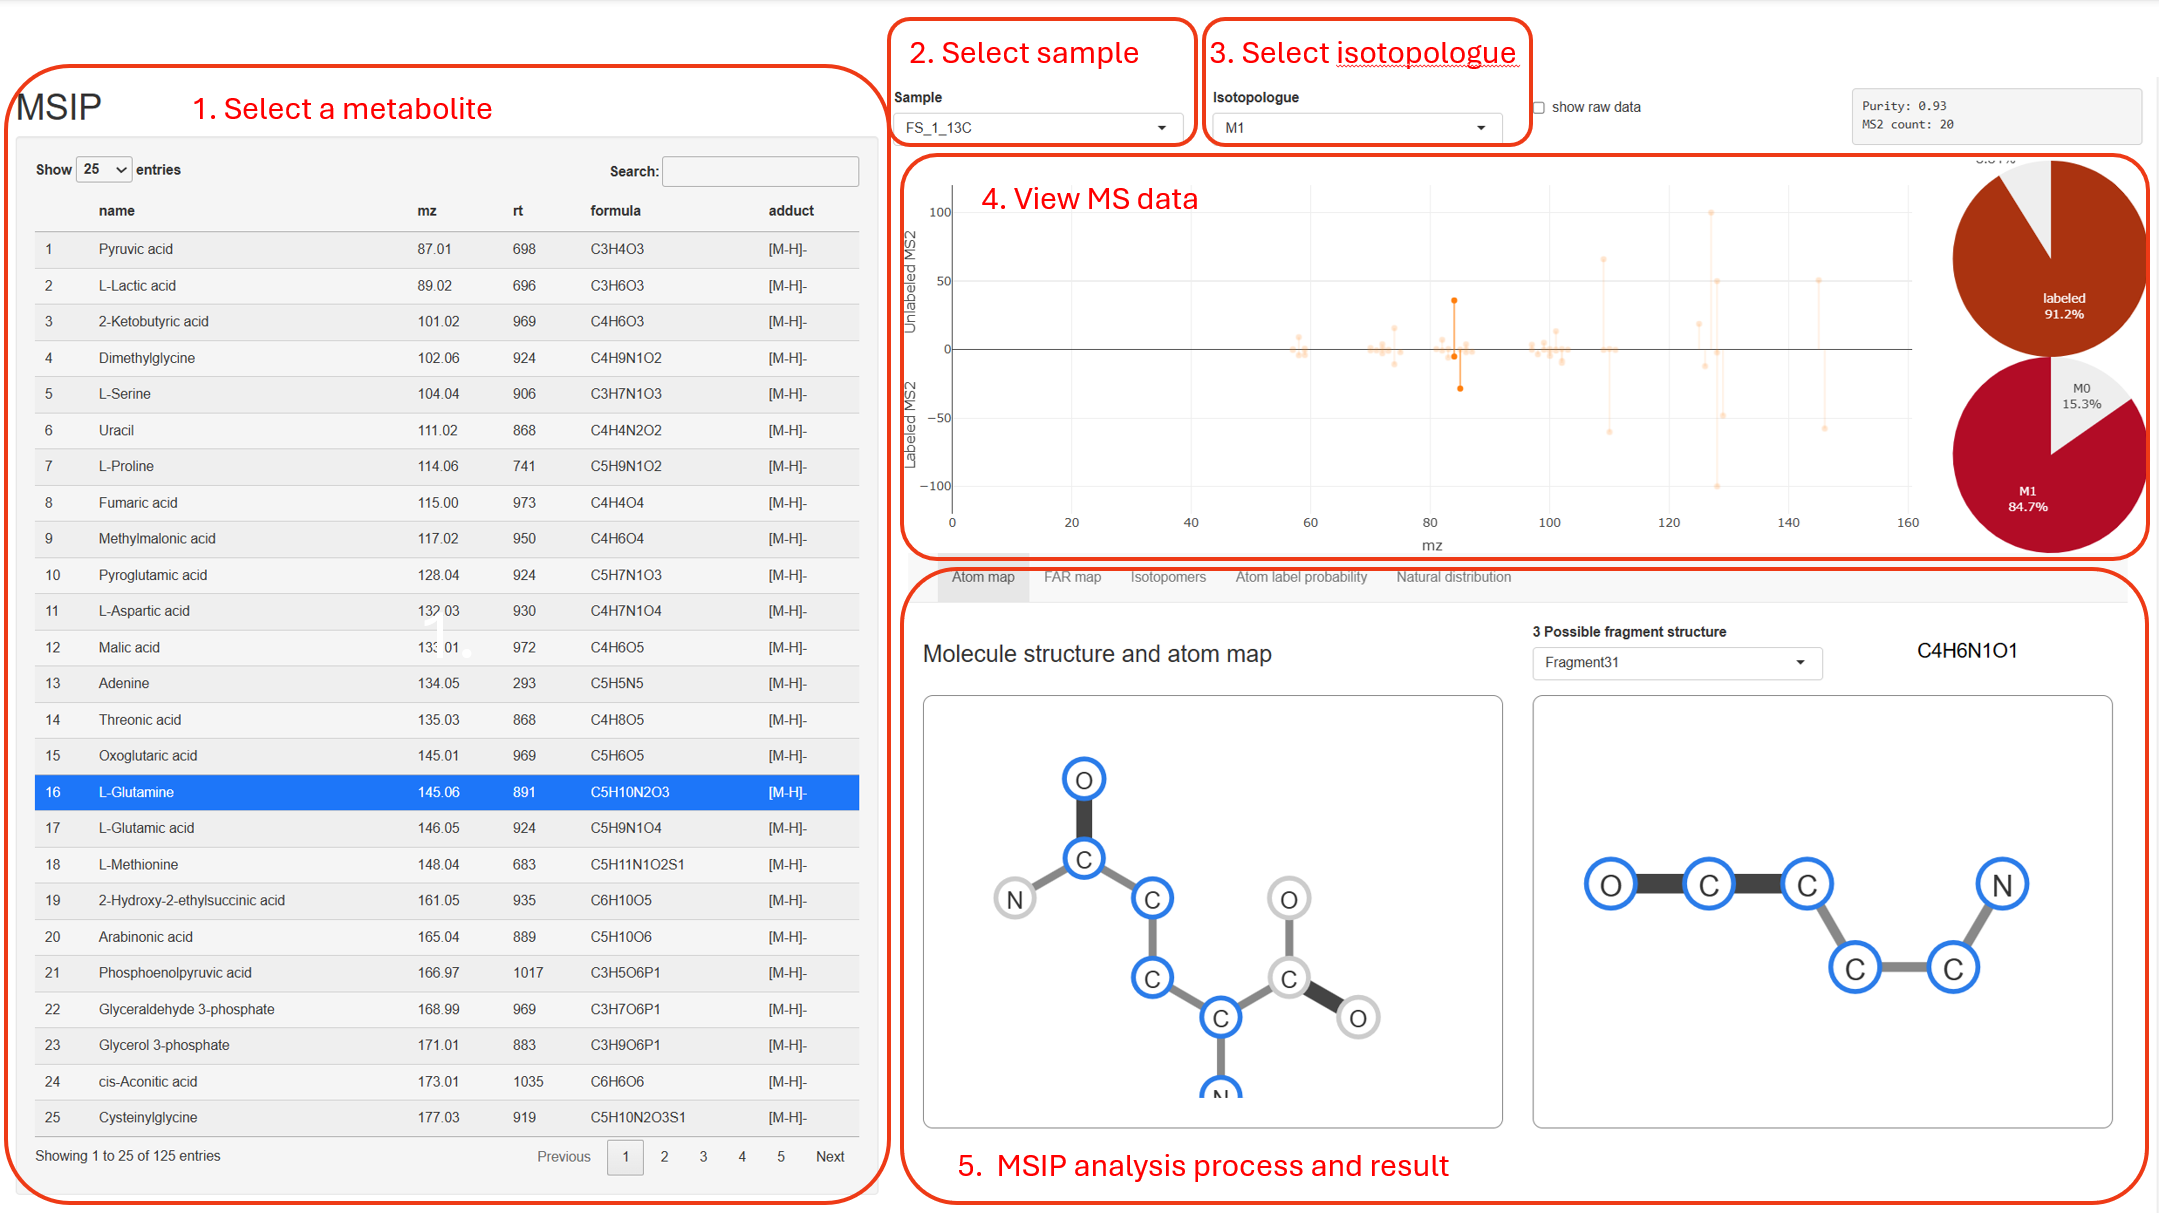
MSIP GUI
Select interesting data
Click Metabolites, Samples, and Isotopologues to select interested data.
The pannel of MS data will show the MS data according to selection.
The pannel of MSIP analysis process and result will show the key data.
MS data
The pannel of MS data show the MS2 spectrum acquired from unlabeled (upper) and labeled (lower) metabolites, isotopic distribution of isotopologues (right-top) and fragment (right-bottom)
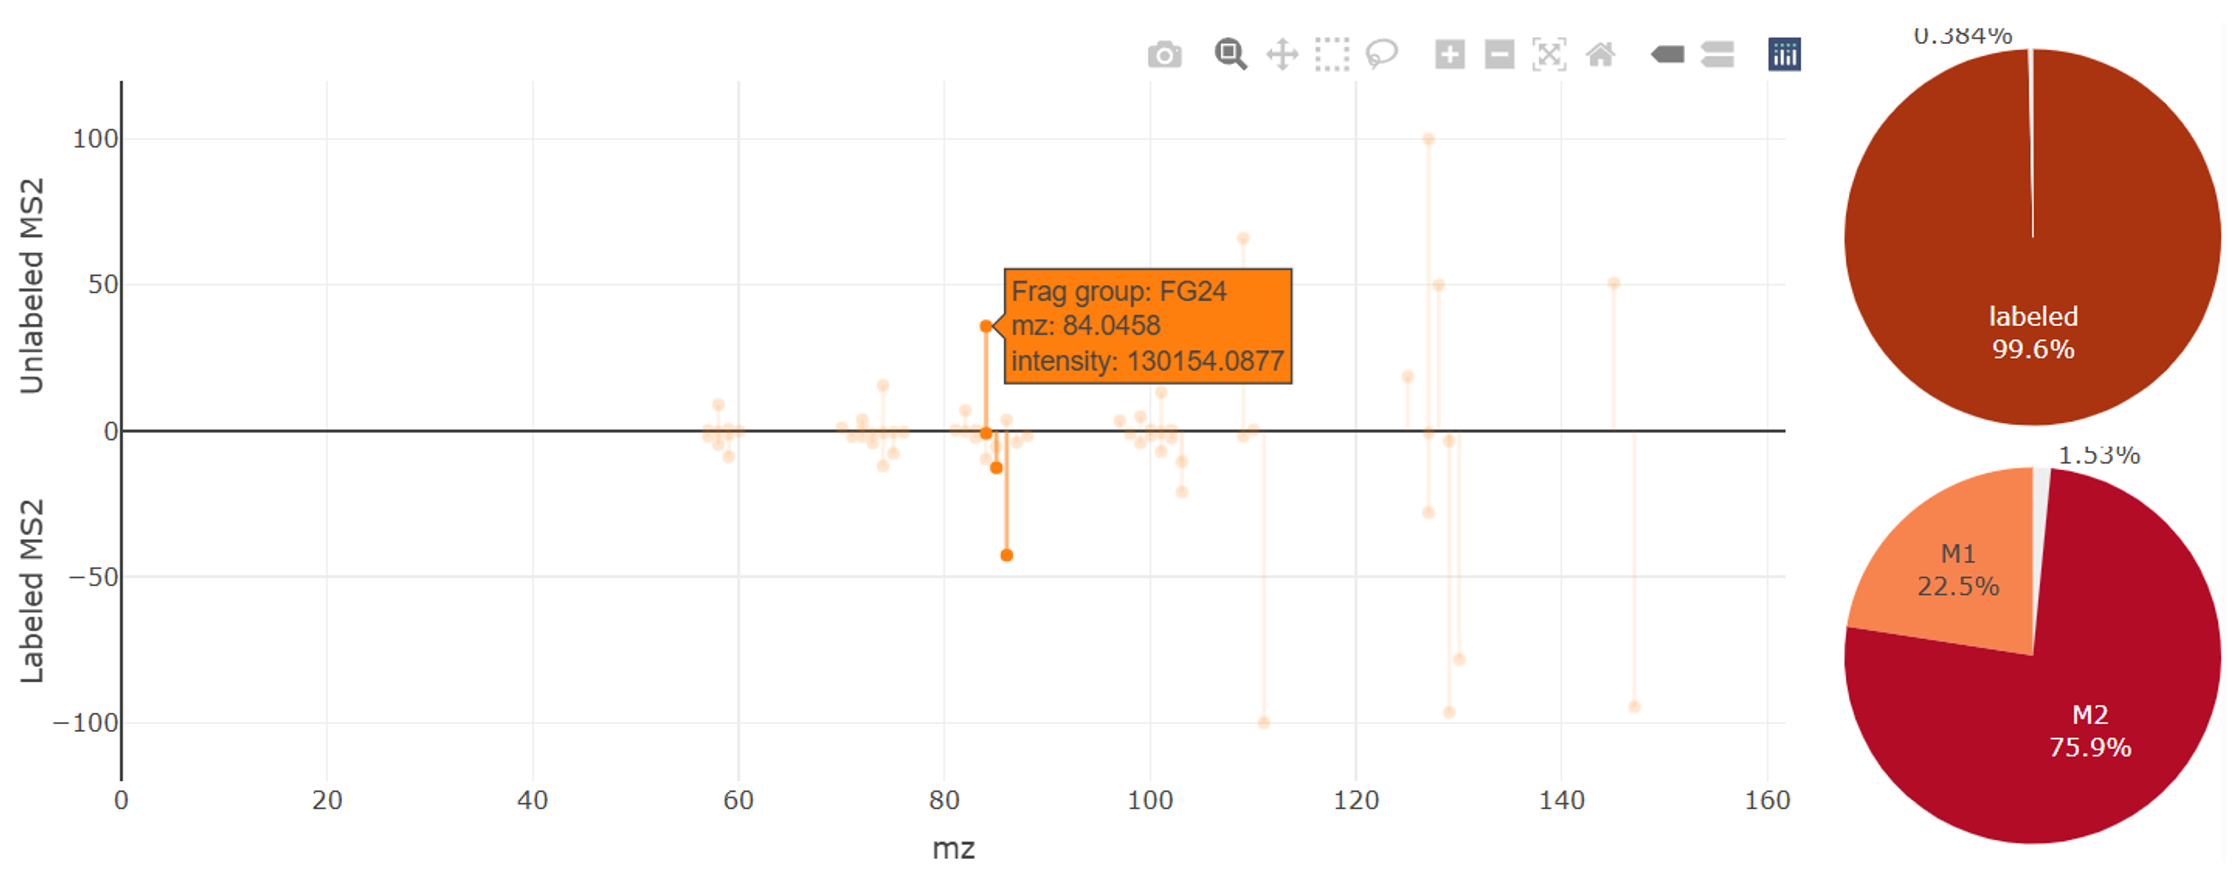
MS data
In biological sample, the MS2 spectrum come from both of tracer-labeled isotopologues and natrual isotopologues, the right-top pie-plot show how much the tracer-labeled isotopologues contribute to this MS2 spectrum
The unlabeled MS2 spectrum show fragments with single peak (M+0), but labeled MS2 show fragments with multiple isotopic peaks (e.g., M+0, M+1, M+2, etc). Zoom out and click one peak to show the information, annotation and isotopic distribution of fragments, the right-bottom pie-plot show corresponding ratio of isotopic distribution.
MSIP analysis
Atom map
The Atom map show the possible structure of fragment (right) and how atoms of fragment map to the position in metabolite molecule (left).MSIP take all possible structures and maps in equal probability for analysis.
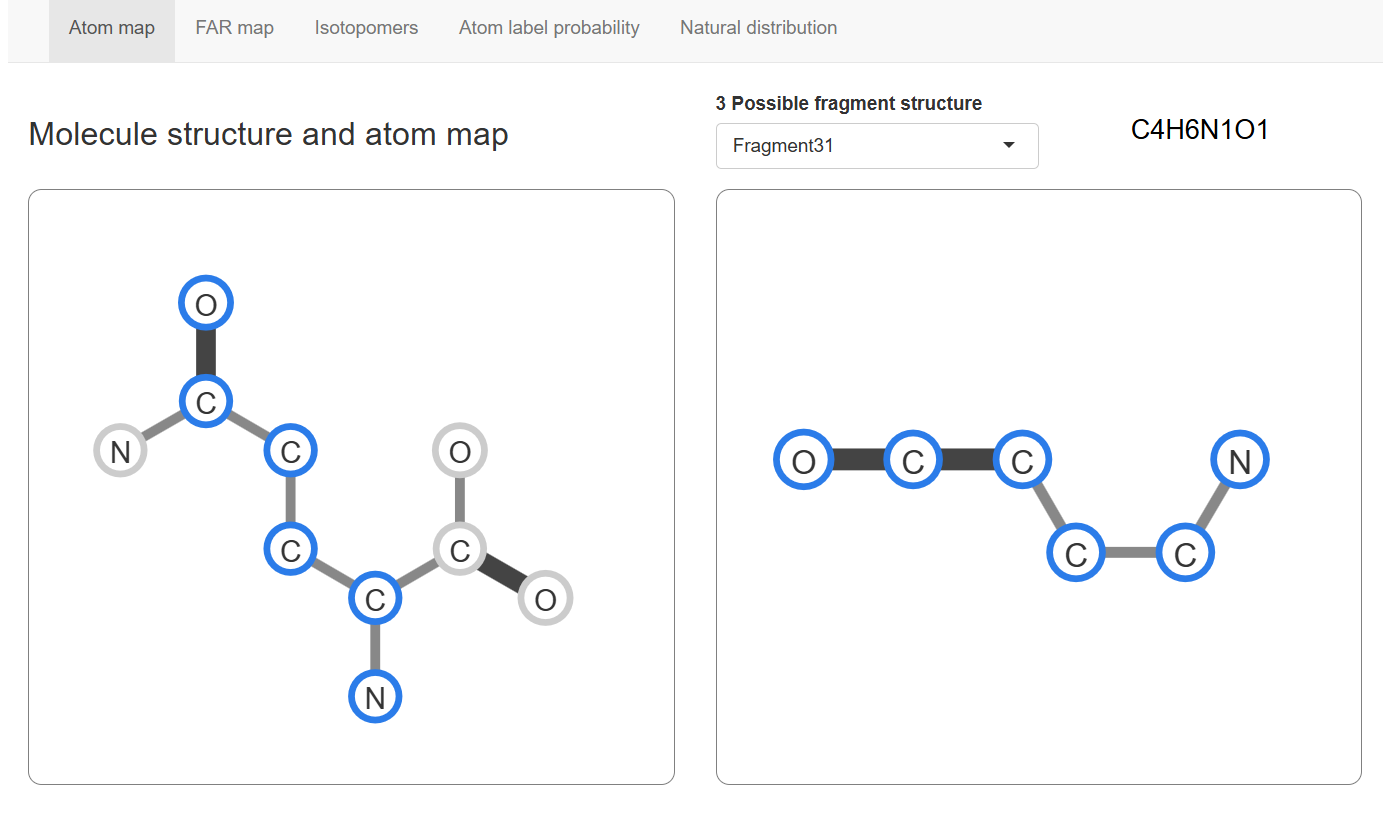
Atom map
FAR map
The Fragment-Atom-Ratio map is integrated from Atom map and isotopic distribution of fragments. This FAR map containing all information required for isotopomers analysis.
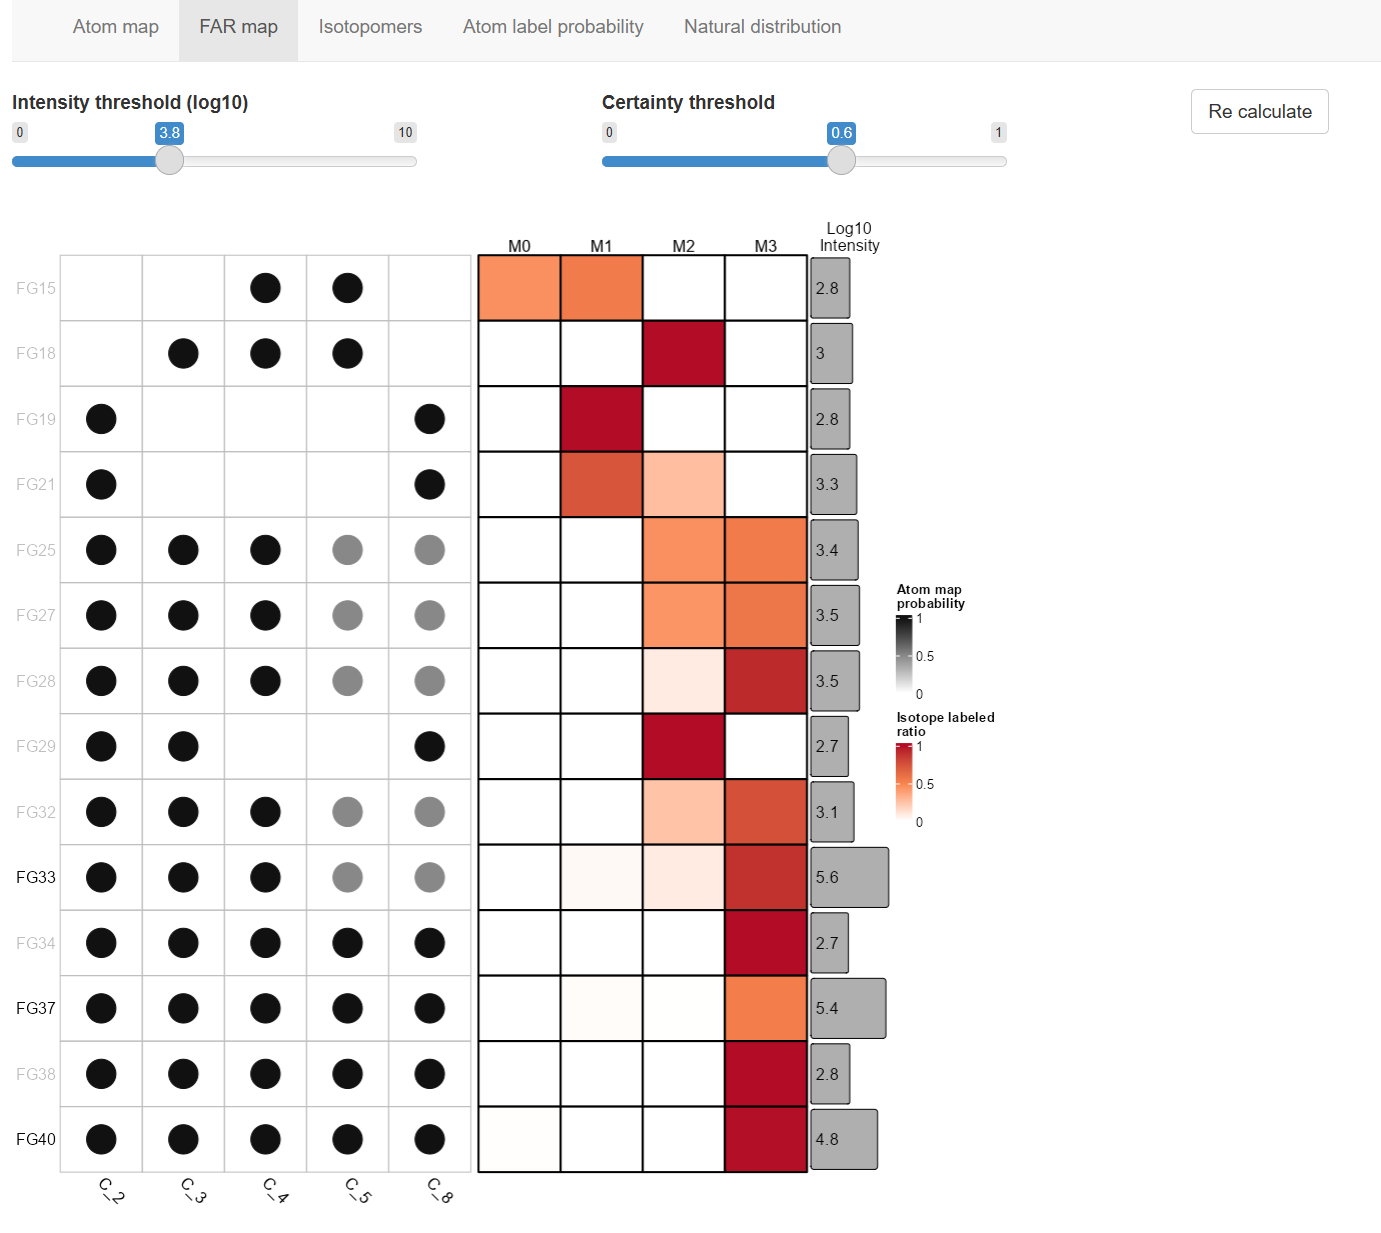
FAR map
Each row show a FG (fragments group, collection of fragments with same formula and m/z), the probability of atom in metabolites molecule map to the FG, the ratio of isotopic distribution and intensity of the FG.
Drag the threshold bar to set intensity and atom map certainty threshold to determine which FG to include in MSIP analysis.
Isotopomers
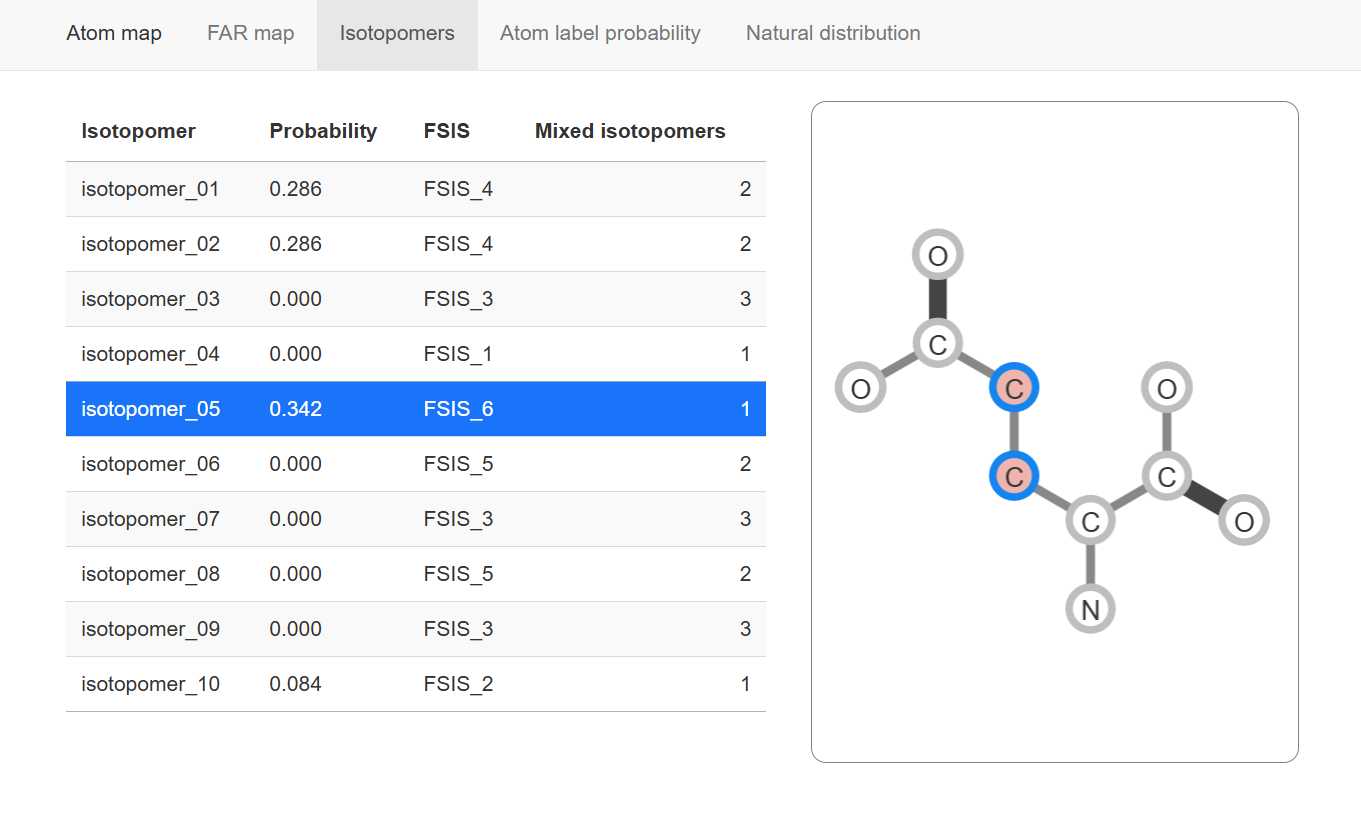
The panel of Isotopomers show all possible isotopomers and their structure analyzed by MSIP.
Isotopomers
The left table show all possible isotopomers and their probability (proportion in the isotopologue). The probability are divided equally from FSIS if some of isotopomers are mixed in one FSIS (FSIS is isotopomers that can not be discriminated due to insufficient fragments information, see Isotopomers analysis for more detail).
The right panel show structure of selected isotopomer, the border-highlight indicate which atoms labeled in this isotopomer.
Atom label probability
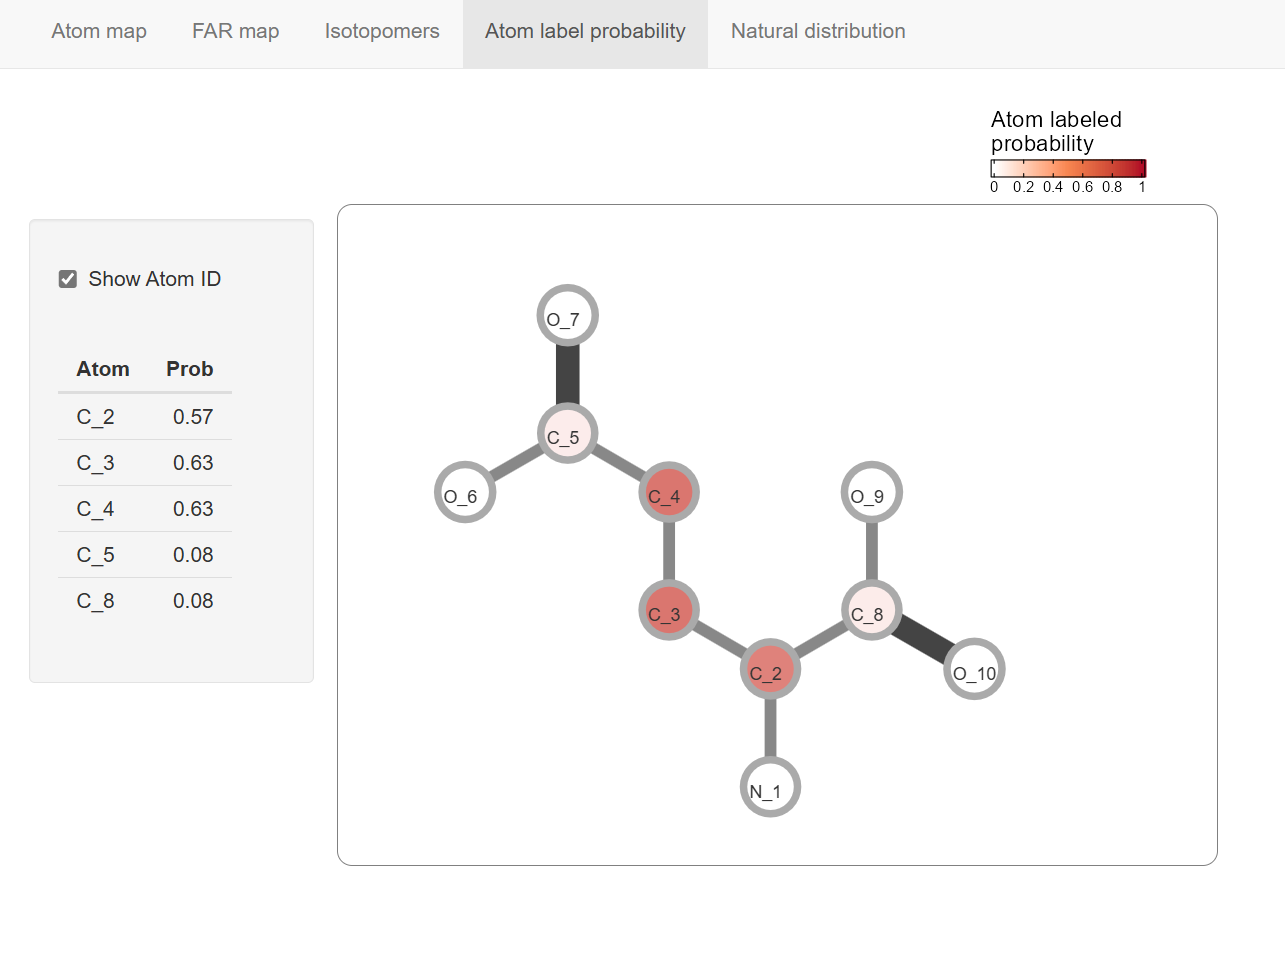
This panel show the atom index (Canonicalizing Number) and position in the metabolite molecule.
The atom label probabilities are integrated from multiple isotopmers.
Atom label probability
Natural distribution
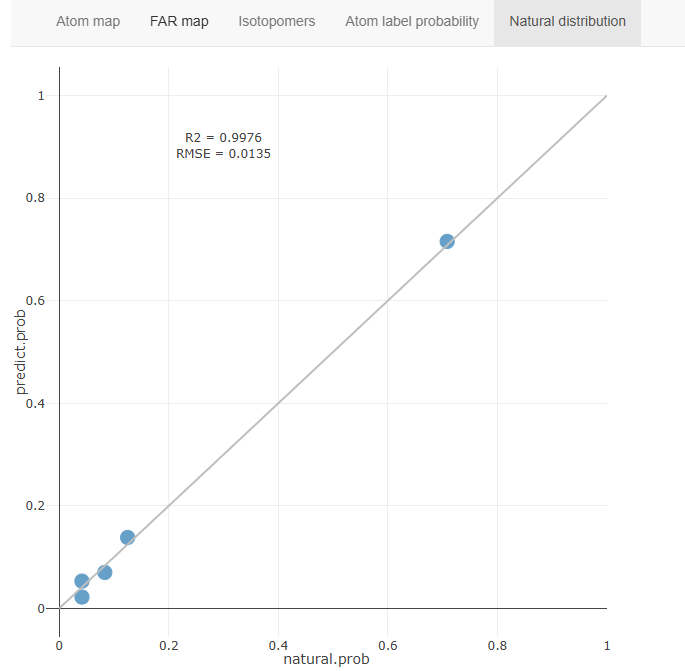
This panel show the correlation between MSIP-predicted probability and natural-distributed ratio of FSIS.
If the MS2 data is totally contributed by natural isotopologues (such as acquired from non-traced sample), it should containing all possible isotopomers with equal probability. Therefore the probability of FSIS should be determined by the fraction of isotopomers count. This feature could be utilized for MSIP validation.
Natural distribution